We all want to customize our graphs just so, and have our personal preferences. Over the past few releases SG Procedures and GTL have added options to customize the look and feel of our graphs. In this article, I will describe new ways in which you can customize your legends. We will also see some new visual options.
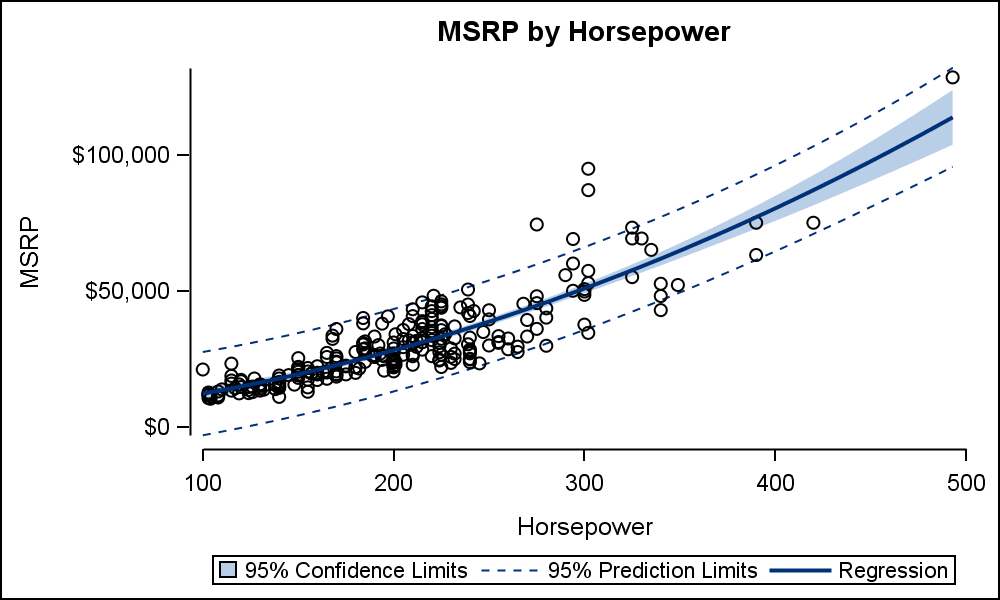
 Here is a common graph with the default legend. The graph displays a quadratic fit for MSRP by Horsepower, using the REG statement with the CLI and CLM options and DEGREE=2.
Note the default legend shows a small color swatch for the 95% confidence band, and two line elements for the Prediction limits and the fit. The line elements are rather long, and designed to be able to represent any of the line patterns that are supported.
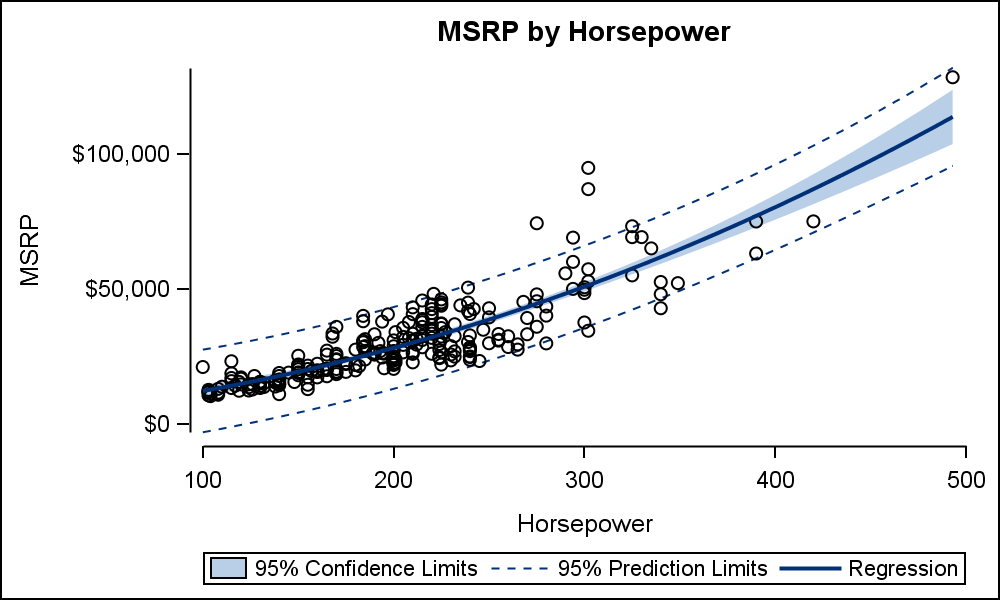
 In this case, we have only two line patterns, one solid and one dashed. So, it is not necessary to use such a long line to represent the lines. Now, with SAS 9.4M2, the lengths of the line segments in the legend can be controlled as I have done here using the LINELENGTH option:
keylegend / linelength=32;
This makes for a much better legend. This normally makes sense only when the line patterns are short, or in case of a grouped plot, you are using a "Color" priority style like HTMLBlue. Now we have addressed the line segment length issue, what about the fill color swatch?
With SAS 9.40M3, new options have been added to the KEYLEGEND statement to provide for more customization of the color swatch. The default color swatches can be smaller than some of you may want, and when using skins, the small swatch is unable to properly represent the colors in the graph. This was also brought to our attention by Dr. LeRoy Bessler during Dan's presentation at SGF 2014 in Washington DC. And then there is always individual personal preferences that come into play. To address these cases, SGPLOT provides the new SCALE, FILLHEIGHT and FILLASPECT options.
 If all you want is to increase (or decrease) the size of the color swatch, and don't want a particular size, you can use the SCALE option as shown on the right. Here I have used the SCALE option to increase the size of the fill swatchs:
keylegend / linelength=32 scale=1.2;
Now, the color swatch is a bit bigger.
 You can fully customize the size and shape of the color swatches using the FILLHEIGHT and FILLASPECT options. Now, we have set the height of the swatch to 2.5% of the graph height and the aspect ratio to GOLDEN. The golden ratio comes from observations of ratios in nature and also from Fibonacci sequence and is equal to 1.618.
keylegend / linelength=32 fillheight=2.5pct fillaspect=golden;
FILLHEIGHT takes a dimension, so it can be pixels (px), percent (pct) inch, cm or mm. All values are scaled by DPI. FILLASPECT accepts a value greater than zero. If the color swatch becomes too big, the legend will drop out.
 The example of the right uses swatches that are 2.5% high with an aspect of 2.5. The bigger swatches provide more space to render the skinned areas.
As expected, GTL provides the same options in the DISCRETELEGEND statement in the ITEMSIZE options bundle.
Those with a keen eye would have noted a few new visual possibilities. SGPLOT now allows you to turn off the internal border of the wall, and control the axes lines to cover only the range of the data using the following option:
styleattrs axisextent=data;
Now the x and y axis lines only extend over the data range. In case of the x axis, the line only goes from the min to max tick mark. The y axis line stops at y=0 tick and extends to the actual data value on the high side. In the past, some users have expressed a preference for such treatment of the axes. Click on any of the fit plots above to see it in more detail.
Full SAS 9.40M3 Code: Legend


1 Comment
Pingback: Bar Chart on Interval Axis - SAS 9.40M3 - Graphically Speaking